

Truck rates per mile have climbed steadily over the past two years, with carriers charging between $1.50 and $2.80 depending on vehicle type and market conditions. Most logistics managers we work with at Loyalty Logistics struggle to predict costs accurately because rates shift based on fuel prices, seasonal demand, and route complexity.
This guide breaks down current pricing across refrigerated, flatbed, and LTL shipments, then shows you the factors driving those numbers and concrete strategies to cut your transportation spend.
Current Truck Rates Per Mile by Vehicle Type
Refrigerated trucks command the highest per-mile rates in the market, and there’s a practical reason why. National reefer rates average $3.39 per mile according to DAT Trendlines as of July 2026, with the Midwest and West regions hitting $3.51 per mile while the Northeast sits lower at $2.61 per mile. The premium exists because refrigerated units consume significantly more fuel to maintain temperature control, and equipment costs run substantially higher than dry vans. If you ship temperature-sensitive goods across long distances, especially in summer months when cooling demand peaks, you’ll see rates at the upper end of that range. The Southeast currently offers the most aggressive reefer pricing relative to other regions, though capacity remains tight at 18.39 loads per truck nationally-down from May’s 20.39-which means you’ll face stiffer competition when you book these lanes.
Flatbed Rates and Regional Opportunities
Flatbed pricing sits at $3.72 per mile nationally, with the Southeast leading at $4.05 per mile and the West trailing at $3.23 per mile. This equipment type shows looser capacity than it did months ago, with load-to-truck ratios falling from May’s 71.57 to June’s 54.37, which translates into slightly softer negotiating leverage for shippers on flatbed moves. Heavy haul and oversized loads push rates higher due to specialized routing, permitting, and liability considerations, so if your freight requires pilot cars or oversize escorts, factor in 15 to 25 percent premiums above standard flatbed quotes. The regional spread matters significantly here-shipping a flatbed load from the Southeast costs roughly 25 percent more per mile than the same move from the West, making lane selection critical for budget planning.
LTL Pricing and Capacity Dynamics
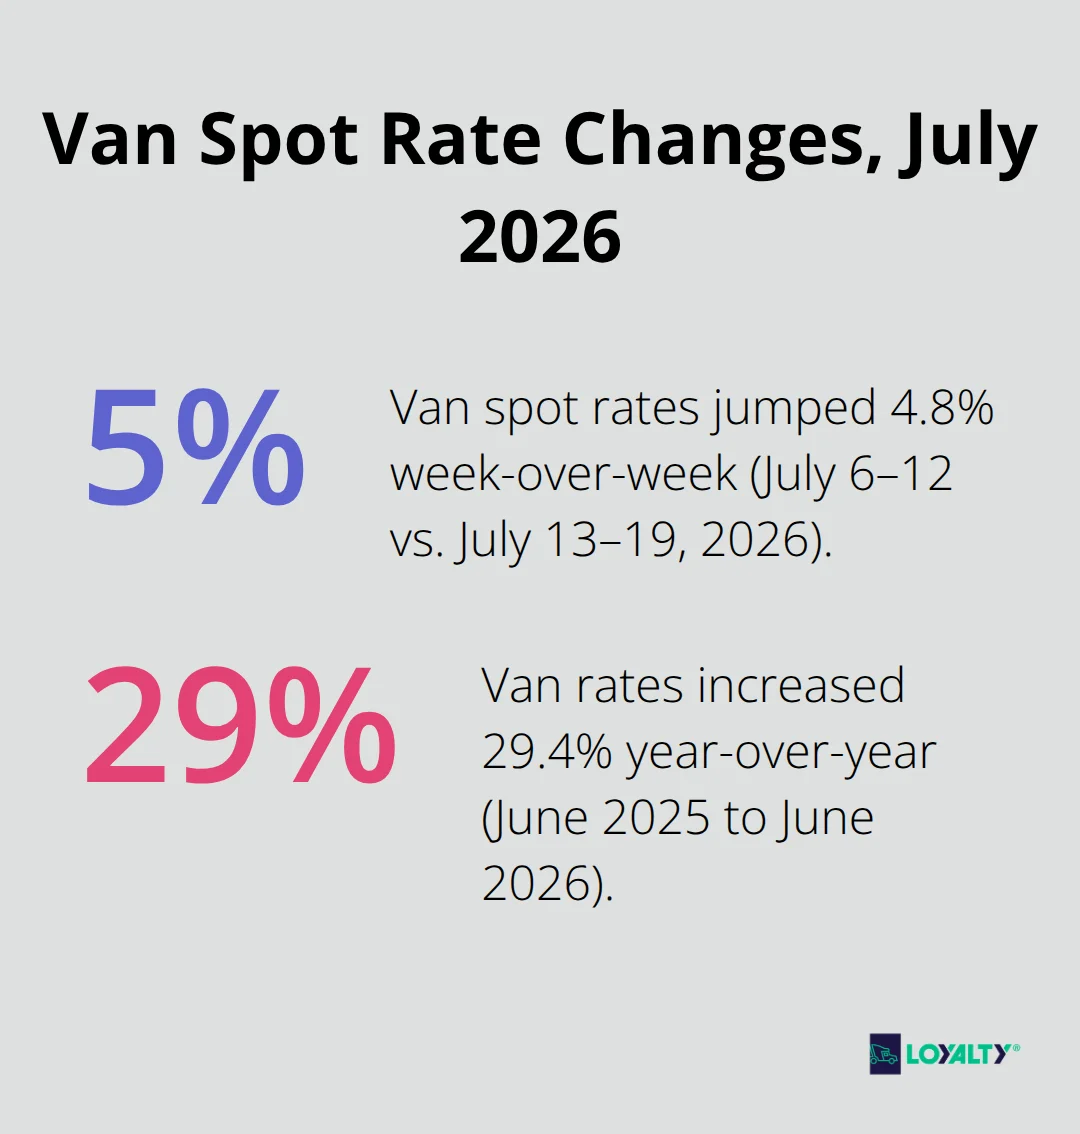
LTL rates don’t follow the same per-mile structure as full truckload services because carriers consolidate partial loads, which changes the economics entirely. National van spot rates average $3.03 per mile with the load-to-truck ratio sitting at 10.61 loads per truck, up substantially from June’s 9.38-a signal that capacity is tightening and upward pressure on rates will likely continue through the remainder of summer. Week-over-week volatility matters here; van spot rates jumped 4.8 percent between July 6–12 and July 13–19, so you need real-time data rather than static monthly figures when you quote LTL shipments. Year-over-year, van rates climbed 29.4 percent from June 2025 to June 2026, which underscores why static pricing models fail logistics managers.
Diesel prices currently sit at $4.83 per gallon nationally, down 81 cents from a month prior but up $1.06 year-over-year, creating ongoing margin compression unless you adjust surcharges accordingly. For LTL moves, try to consolidate shipments into full truckload quantities whenever possible-the per-unit cost advantage of a full load versus multiple partial shipments can reach 30 to 40 percent depending on the lane and season.
How Fuel Costs Shape Your Bottom Line
Diesel price volatility directly impacts your transportation costs across all equipment types. California diesel sits at $6.49 per gallon, while the East Coast runs $4.89 per gallon and the Midwest $4.75 per gallon, creating significant regional cost variations that static national rates fail to capture. Long-haul lanes in high-fuel-cost regions compress margins unless you apply regional adjustment factors or fuel surcharges to your quotes. The gap between regions means a cross-country reefer shipment originating in California faces substantially higher per-mile costs than the same move starting from the Midwest, so you must account for these differences when you build your pricing strategy rather than applying blanket rates across all routes.
Understanding these regional and equipment-specific rates positions you to negotiate more effectively with carriers and identify which lanes offer genuine margin opportunities versus those that demand careful cost management.
What Drives Truck Rate Changes
Fuel Costs and Regional Price Spreads
Diesel prices remain the single most predictable lever you can control in your transportation budget, and the data proves it. Prices swung $1.06 year-over-year as of July 2026, moving from $3.77 per gallon in July 2025 to $4.83 per gallon today according to DAT Trendlines, and this volatility cascades directly into your per-mile quotes. The regional spread matters more than the national average-California diesel at $6.49 per gallon versus Midwest diesel at $4.75 per gallon creates a $1.74 gap that compresses margins on long-haul West Coast moves unless you apply fuel surcharges systematically. Most logistics managers treat fuel as a fixed cost when it actually represents your most variable expense, which means you need to adjust quotes weekly rather than monthly.
Load-to-Truck Ratios as Early Warning Signals
Load-to-truck ratios signal when capacity will tighten and rates will climb, so you must watch these numbers obsessively. Van load-to-truck jumped from 9.38 in June to 10.61 in July 2026, and that single metric predicted the 4.8 percent week-over-week rate increase that followed. Flatbed ratios fell from 71.57 in May to 54.37 in June, which told you flatbed pricing would soften and gave you a window to lock in contract rates before capacity tightened again. Year-over-year comparisons reveal the true trend beneath monthly noise-van rates climbed 29.4 percent from June 2025 to June 2026, reefer rates 21.0 percent, and flatbed rates a dramatic 35.8 percent, showing that static pricing models fail you consistently.
Distance, Routes, and Seasonal Demand Patterns
Distance and route complexity interact with fuel costs in ways that generic per-mile rates obscure entirely. A 500-mile Northeast lane costs far less to operate than a 500-mile California lane because fuel consumption, tolls, and driver hours accumulate differently, yet many shippers apply identical per-mile rates across both corridors. Seasonal demand peaks in Q3 and Q4, when retailers stock inventory and food processors move harvest volumes, driving load-to-truck ratios up and forcing rate increases across all equipment types. July 2026 data shows reefer spot rates declined 8.4 percent week-over-week while van rates rose 4.8 percent, illustrating that equipment-specific demand patterns matter more than broad market trends.
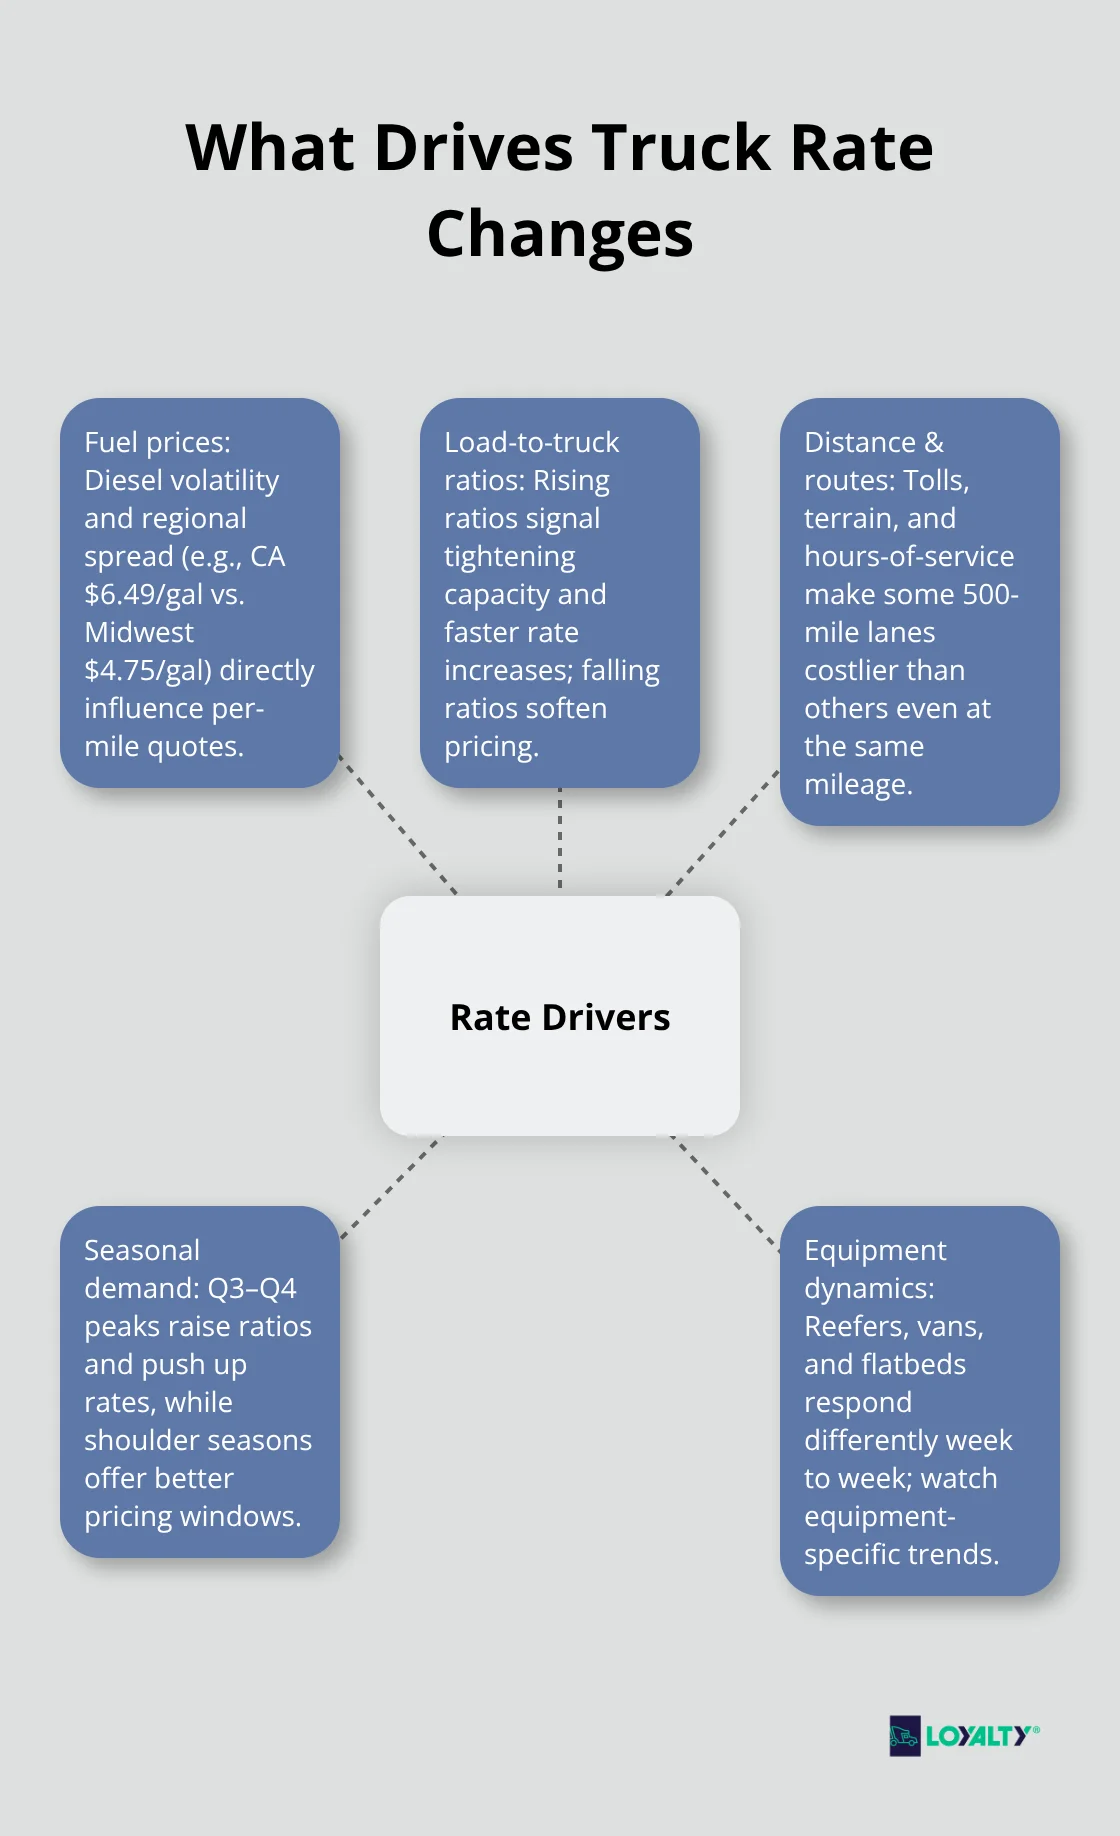
You gain negotiating power by shifting shipments to shoulder seasons-May and September typically offer softer pricing than June through August-and by consolidating shipments to fill trucks rather than paying LTL premiums on partial loads, which can cost 30 to 40 percent more per unit depending on the lane. These tactical moves directly impact your ability to manage costs across your entire transportation network.
How to Cut Transportation Costs Without Sacrificing Service
Consolidate Shipments to Eliminate LTL Premiums
The math is simple: you cannot negotiate your way out of a poorly planned load. Most logistics managers spend their time haggling over per-mile rates when they should focus on consolidation and route optimization, which yield far bigger savings. If your team books ten partial loads per week when five full truckloads would move the same freight, you pay 30 to 40 percent premiums on every partial shipment according to industry benchmarks. Start with an audit of your shipment patterns across the past twelve months-map out origin and destination pairs, identify which lanes repeat weekly or monthly, and calculate whether consolidating smaller shipments into full truckloads saves money even if you hold freight for 24 to 48 hours. The answer almost always favors consolidation. Reefer rates sit at $3.39 per mile nationally as of July 2026, but LTL reefer moves cost substantially more per unit because carriers must handle temperature control for smaller volumes. A logistics director who shifts from four weekly reefer LTL shipments to one consolidated full reefer truckload cuts per-unit costs dramatically while freeing carrier capacity for other lanes.
Verify Mileage and Route Efficiency
Route optimization works similarly to consolidation-it cuts costs without requiring carrier negotiations. Use mapping tools to calculate actual miles between pickup and delivery points rather than relying on estimates, then compare the real distance against your per-mile quote to spot lanes where rates look aggressive. A 450-mile move quoted at per-mile rates should cost roughly 450 times the rate, but many carriers pad mileage estimates, so verification matters. This single practice-checking actual versus quoted mileage-catches overcharges that accumulate across dozens of shipments monthly.
Lock in Contracts Before Capacity Tightens
Long-term contracts with carriers lock in pricing before capacity tightens and rates climb, which matters far more than spot-rate shopping. Load-to-truck ratios jumped from 9.38 in June to 10.61 in July 2026, signaling that van spot rates would rise 4.8 percent week-over-week, and shippers who locked contracts before that jump avoided the increase entirely. Flatbed load-to-truck ratios fell from May’s 71.57 to June’s 54.37, which told experienced procurement teams to secure flatbed capacity while leverage still favored shippers. Year-over-year data reveals the real stakes-van rates climbed 29.4 percent from June 2025 to June 2026, reefer rates 21.0 percent, and flatbed rates 35.8 percent according to DAT Trendlines. A three-year contract signed at June 2026 rates would have cost you 29.4 percent less per van mile than spot rates from June 2025, which translates to tens of thousands of dollars on even modest volumes.
Structure Fuel Escalation Clauses and Volume Commitments
Negotiate contracts that include fuel escalation clauses tied to diesel prices-currently $4.83 per gallon nationally but ranging from $4.75 in the Midwest to $6.49 in California-so your rates adjust automatically when fuel costs spike rather than forcing painful mid-contract renegotiations. Carriers accept fuel clauses because it reduces their risk, and you benefit because rate increases stay predictable. Volume commitments matter more than individual lane rates when you negotiate; a carrier would rather secure 200 shipments monthly at stable margins than chase higher per-mile rates on sporadic loads. Offer consistent volumes across your top three to five lanes, then ask carriers to discount those lanes in exchange for volume guarantees. This approach shifts the conversation from per-mile haggling to partnership economics, where both parties win through predictability and scale.
Final Thoughts
Truck rates per mile have climbed 29.4 percent for vans, 21.0 percent for reefers, and 35.8 percent for flatbeds year-over-year from June 2025 to June 2026, making static pricing models obsolete. Logistics managers who monitor load-to-truck ratios, regional fuel costs, and seasonal demand patterns gain real negotiating power, while those relying on outdated benchmarks consistently overpay. Your transportation budget depends less on haggling over per-mile rates and far more on three concrete actions: consolidating shipments to eliminate LTL premiums that cost 30 to 40 percent more per unit, locking long-term contracts before capacity tightens and rates spike, and structuring fuel escalation clauses so pricing stays predictable when diesel swings between $4.75 and $6.49 per gallon across regions.
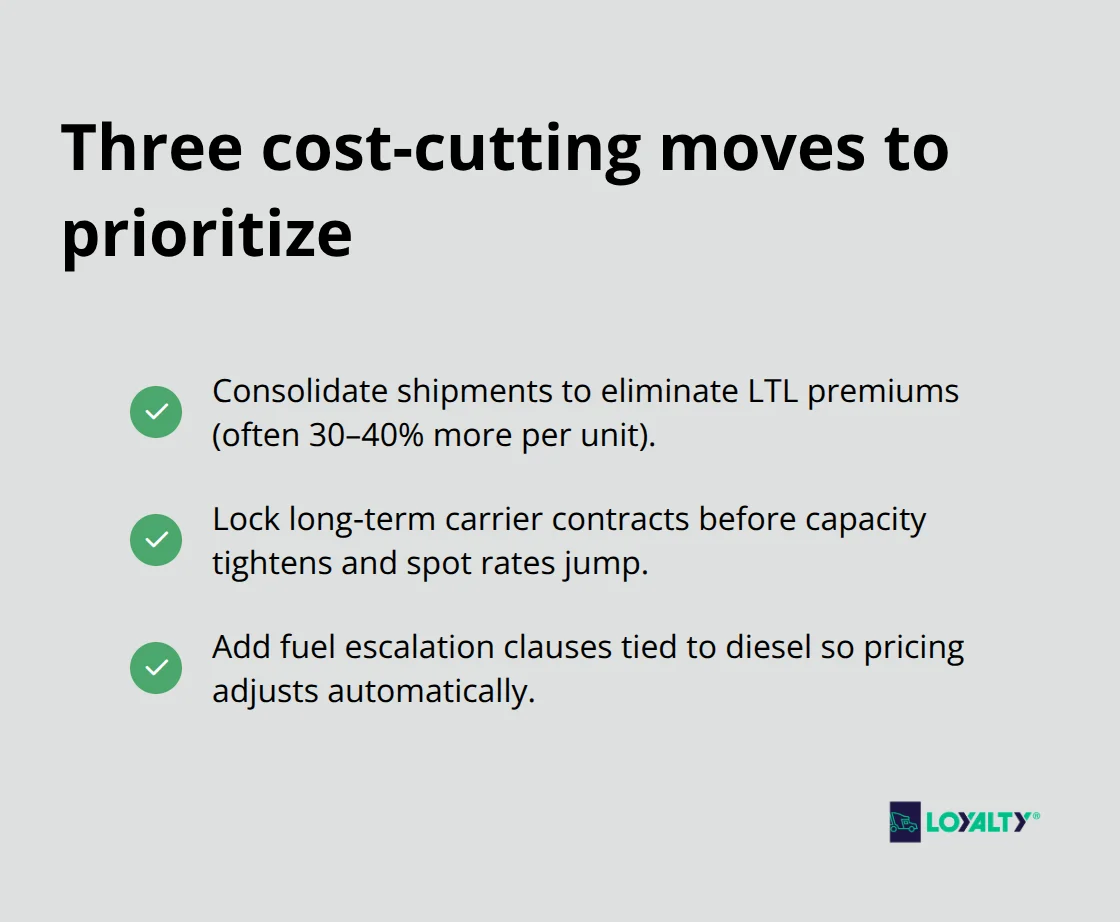
Start by auditing your shipment patterns from the past twelve months and map your top lanes to calculate whether consolidation saves money. Contact carriers with volume commitments rather than spot-rate requests, because consistent shipments across your core lanes yield far better pricing than chasing individual loads. Build fuel escalation clauses into every contract so rate increases stay automatic and predictable rather than forcing painful renegotiations when diesel prices spike.
Loyalty Logistics specializes in refrigerated, flatbed, and LTL shipping across the U.S., Canada, and Mexico with expertise in regional pricing dynamics and seasonal demand patterns that generic benchmarks miss entirely. Reach out to discuss how consolidation, contract structuring, and fuel management can reduce your transportation costs while maintaining service reliability.
