

Spot freight rates swing wildly based on real-time market conditions, and most logistics managers don’t have a clear strategy for managing them. At Loyalty Logistics, we’ve seen shippers waste thousands by reacting to price spikes instead of planning ahead.
This guide breaks down what drives spot rates, which factors matter most, and how to actually save money when you need capacity fast.
How Spot Rates Work vs. Contract Pricing
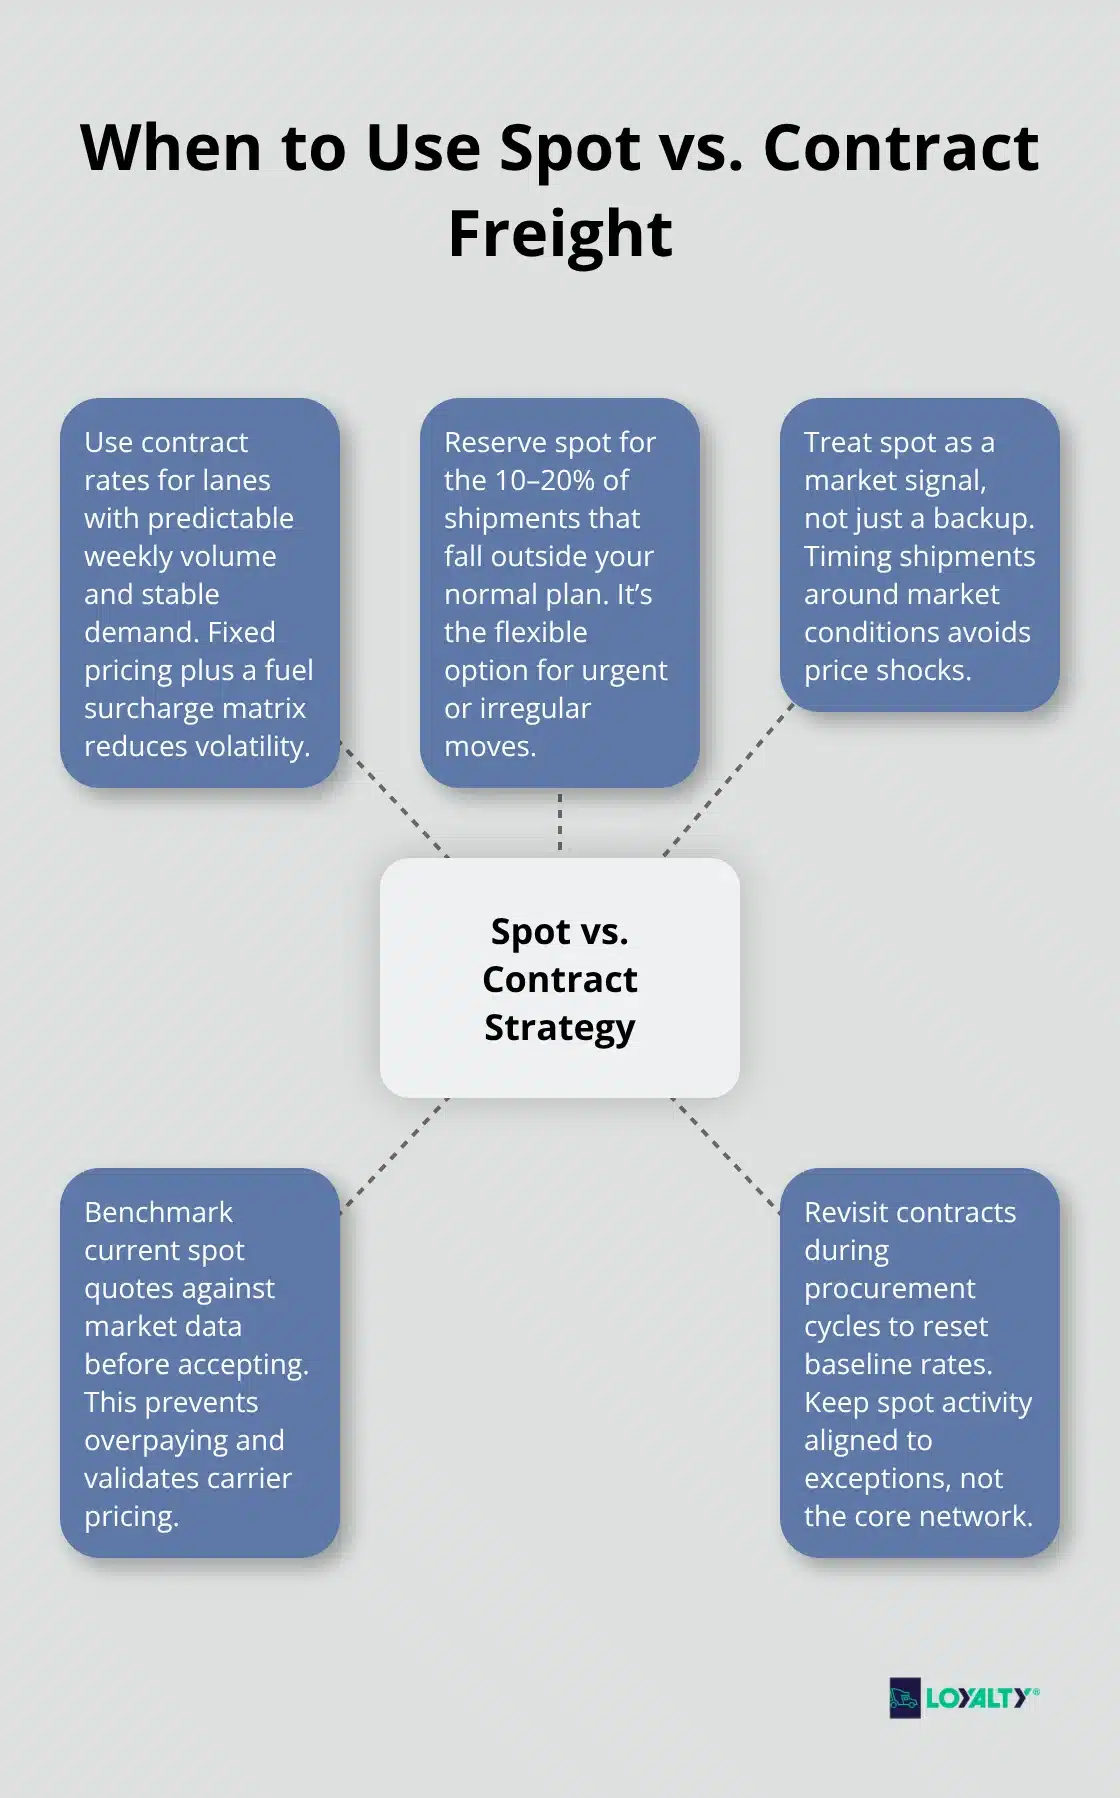
Spot freight rates are prices you pay for a single truckload at the moment you need capacity, determined entirely by supply and demand right now. Contract rates, by contrast, lock in pricing for an agreed volume over months or a year, with both you and the carrier committing to specific lanes and frequencies. The difference matters enormously because spot rates fluctuate daily-sometimes hourly-while contract rates stay fixed. Fuel costs account for roughly 30% of a carrier’s operating expenses, and contract rates build in a fuel surcharge calculated through a matrix, so carriers price them to cover expected fuel costs plus margin. Spot rates, however, respond immediately to fuel spikes, driver shortages, or sudden demand surges, which is why you might see a lane jump 15–20% in a single week. Logistics managers often treat spot as a backup option rather than a market signal, which leaves them vulnerable to price shocks. The real tactical move is understanding when each makes sense: use contracts to anchor lanes with predictable weekly volumes and stable demand, then reserve spot for the 10–20% of shipments that fall outside your normal plan. Most shippers run at least one procurement event per year to reset contract pricing, but many miss the opportunity to benchmark their current spot rates against market data to know whether they’re actually getting deals or paying premiums.
Why Spot Rates Spike Without Warning
Spot rates rise sharply when carrier capacity tightens faster than shipper demand drops. During peak seasons-harvest months, holiday retail buildup, or post-tariff surges-carriers prioritize their committed contract loads first, leaving less equipment available for spot. This creates an immediate price pressure that contract holders don’t feel. Fuel prices moving up 10–15% in a month can push spot rates higher because carriers have no fuel surcharge matrix to cushion the blow; they simply pass costs through instantly. Driver availability compounds the problem: if a region loses drivers to better-paying contract lanes or higher-paying dedicated fleets, spot capacity evaporates. At the same time, shippers who’ve been holding inventory suddenly ship it all at once, creating a supply-demand mismatch that spot markets can’t absorb smoothly. You should set rate alerts on tools like DAT’s RateView Analytics or similar platforms to catch when your key lanes spike, then decide whether to ship early, consolidate with slower transit modes, or wait for rates to ease. Reacting within 48 hours of a spike often saves more than reacting a week later when everyone else has also moved.
Real-Time Data Beats Guesswork
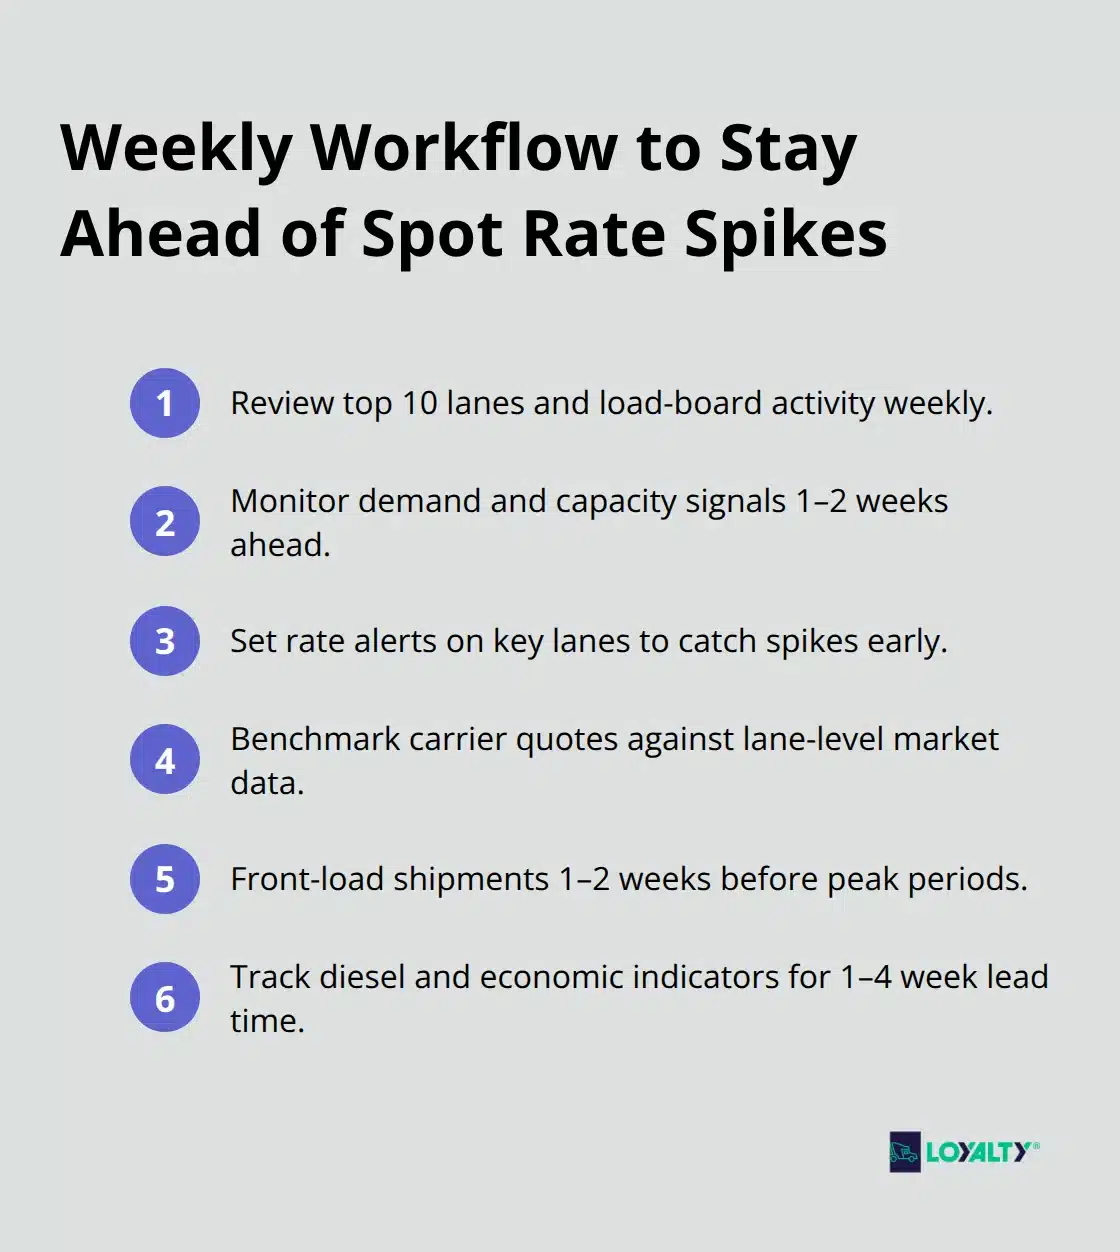
Spot rates change based on load availability and carrier utilization, both of which are visible through load boards and market rate indices if you know where to look. The DAT Load Board shows current freight demand across lanes, revealing where spot loads are piling up and where capacity is tight. RateView Analytics provides lane-level historical and current rates so you can see whether today’s quote is actually higher than last week or whether it’s normal for this time of year. Without this data, most managers rely on carrier quotes alone, which means they negotiate blind. A carrier quoting you $2,800 for a lane might be 8–12% above market, or they might be 5% below-you won’t know unless you benchmark against real market rates. The difference between knowing and guessing is roughly 5–10% of your spot freight spend annually. You should set up a simple dashboard combining load-board activity with historical rate trends for your top 10 lanes, then review it weekly. This takes 90 minutes to build but saves hours of reactive negotiation and prevents you from overpaying on urgent shipments because you lack context.
How to Spot Overpriced Quotes
Carriers often quote rates without context, leaving you unable to judge whether you’re paying fair market value. Lane-level benchmarking against real market data transforms this dynamic. Tools that track current and historical rates for specific corridors let you compare what a carrier quotes against what the market actually paid last week and last month. If a carrier quotes $3,100 for a lane where the 50th percentile rate sits at $2,950, you know you’re paying a premium and can push back or shop elsewhere. Most logistics managers skip this step because they assume all quotes are roughly equal, but 5–10% rate variance across carriers on the same lane is normal. The practical move is to request quotes from at least three carriers per lane, then benchmark each quote against market data before you accept. This approach takes an extra 30 minutes per shipment but prevents overpayment and strengthens your negotiating position. Once you understand where market rates actually sit, you can also identify which lanes offer the best value and which ones warrant a shift to contract pricing or alternative modes.
What Drives Spot Rate Swings
Fuel Costs Create Immediate Price Pressure
Fuel costs move spot rates faster than any other factor because carriers have zero cushion when prices jump. Diesel fuel accounts for roughly 30% of a carrier’s operating expenses, and when fuel spikes 10–15% in a month, carriers immediately raise spot quotes to protect margin. Contract rates include a fuel surcharge matrix agreed upfront, so contract holders see predictable adjustments. Spot shippers, however, absorb the full shock instantly. If diesel climbs from $3.20 to $3.60 per gallon, a carrier moving a 500-mile load burns an extra $100 in fuel, and that cost hits your quote the next day.
Economic conditions amplify this effect: when inflation rises or interest rates climb, carriers face higher financing costs for equipment and fuel purchases, which they pass directly to spot rates. Conversely, when the economy softens and shippers reduce shipment frequency, carriers cut spot rates aggressively to fill empty trucks. Monitor diesel futures prices and economic indicators weekly because they signal rate moves 1–4 weeks ahead. If diesel starts climbing, lock in spot shipments early or shift urgent loads to contract lanes where surcharge matrices cap your exposure.
Seasonal Demand Swings Catch Most Managers Off Guard
Seasonal demand swings create the most brutal spot rate spikes because they’re predictable yet still catch most managers off guard. Harvest season from August through October floods spot markets with agricultural shipments, tightening capacity across southbound lanes into Mexico and northbound corridors from the Midwest. Holiday retail buildup in September and October pushes rates higher as shippers race to stock shelves. Post-tariff surges, like the pull-forward demand seen in early 2025 before potential trade policy changes, create sudden volume explosions that spot capacity cannot absorb.
Carriers prioritize their committed contract loads first, leaving minimal equipment for spot shipments, which drives rates up 20–30% above baseline. Driver availability compounds the pressure: when regional lanes become congested, experienced drivers gravitate toward better-paying dedicated or contract work, shrinking the driver pool available for spot moves. Equipment shortages follow because carriers with fewer drivers can’t run full fleets.
Weather, Backlogs, and Regional Disruptions Tighten Capacity
If a region experiences unexpected weather, rail backlogs, or port delays, spot capacity tightens further as carriers redirect trucks to higher-paying contract work. These disruptions hit fast and spread across multiple lanes simultaneously, leaving spot shippers scrambling for equipment at inflated rates. A single port backup can cascade through regional trucking markets within days, pushing rates up across dozens of lanes at once.
Front-Load Shipments Before Seasonal Peaks Hit
The actionable response is to front-load shipments before seasonal peaks hit. If you know harvest season peaks in late August, book your September and October spot loads in July when rates sit 10–15% lower. Track your top lanes using load-board data to see when demand starts building, then execute shipments ahead of the rush. For cross-border Mexico freight, where northbound demand consistently outpaces southbound three-to-one, expect sustained tightness on southbound lanes during peak seasons. Plan backhaul opportunities to move freight northbound and southbound, which stabilizes your access to equipment and often improves rates on both directions.
Tools like DAT’s Trendlines weekly data highlight fuel and economic shifts that affect rates, giving you lead time to adjust strategy before rate spikes hit your lanes. Understanding these drivers transforms spot freight from a reactive scramble into a planned operation where you move shipments when rates favor you, not when capacity forces your hand.
How to Lock in Better Spot Rates Before Prices Jump
Spot freight markets reward managers who move first and punish those who react. The difference between shipping when rates favor you versus when capacity forces your hand is 15–25% of your freight bill. Most logistics managers treat spot as a last resort, quoting carriers only when they need capacity, which means they negotiate from weakness. Instead, treat spot rate data as a planning tool that tells you exactly when to ship and when to wait.
Use Load-Board Data to Ship Ahead of Rate Spikes
Load boards like DAT show where freight demand builds 1–2 weeks ahead of rate spikes, giving you a window to execute shipments before the rush hits. If you see northbound Mexico demand climbing on the load board, that’s your signal to book southbound loads early while capacity exists and rates sit lower. Cross-border freight into Mexico shows this pattern clearly: northbound demand consistently outnumbers southbound three-to-one, meaning southbound rates spike predictably during peak seasons when shippers rush to move inventory.
Review load-board activity and rate trends for your top 10 lanes weekly, taking 30 minutes to scan where demand builds. When you spot early signals, execute shipments 1–2 weeks ahead of peak season rather than during it. This single discipline cuts your spot freight costs 8–12% annually because you move volume when rates sit at their monthly low rather than their peak. A 15% rate reduction on 20% of your freight spend equals 3% off your total transportation budget.
Build a Multi-Carrier Network on Every Major Lane
A carrier network with three to five trusted partners on each major lane transforms your negotiating position from weak to strong. When you have only one carrier quote, you negotiate blind and accept whatever price they offer. When you have three quotes, you can benchmark each against market data and push back on outliers.
Identify your 10 most-used lanes, then request quotes from at least three carriers on each lane before you need capacity urgently. Store these baseline quotes in a spreadsheet alongside current market rates from RateView Analytics, then compare new quotes against both your baseline and the market percentile. If a carrier quotes $3,200 and your baseline was $2,950 while the market 50th percentile sits at $2,980, you know the quote is 7–8% above fair value and you can either push back or move the load to a different carrier.
Leverage Competition to Negotiate Fair Pricing
Carriers know which shippers have alternatives and which ones don’t, and they price accordingly. Shippers with only one carrier option pay 5–10% premiums because carriers face no competition. Shippers with three carriers on every lane pay market rates because carriers know you’ll shop elsewhere.
This requires upfront relationship building during low-demand periods, but it pays dividends when spot rates spike and you need capacity fast. The carriers who’ve built relationships with you will prioritize your loads over spot-market strangers, and you’ll have leverage to negotiate on price because they know you have options. Carriers with strong relationships also commit equipment to your lanes during peak seasons, reducing the scramble for capacity when rates spike highest.
Final Thoughts
Spot freight rates reward planning over panic. The managers who save the most money understand what drives rates and move shipments when market conditions favor them, rather than reacting to price spikes. You now know that fuel costs, seasonal demand, and capacity tightness create predictable patterns you can exploit, and load-board data signals rate moves 1–2 weeks ahead, giving you time to execute shipments before peaks hit. Benchmarking quotes against real market data prevents overpayment on every single load, and building a multi-carrier network on your major lanes removes the guesswork and gives you negotiating leverage when spot freight rates climb.
The practical next step is immediate: identify your 10 most-used lanes, pull current market rates from RateView Analytics, and request quotes from at least three carriers on each lane this week. Store those quotes in a spreadsheet alongside market benchmarks so you have a baseline for future negotiations, and set up rate alerts on your key lanes so you catch spikes early and can decide whether to ship ahead of the rush or wait for rates to ease. Review load-board activity weekly for 30 minutes to spot demand building before it hits your rates.
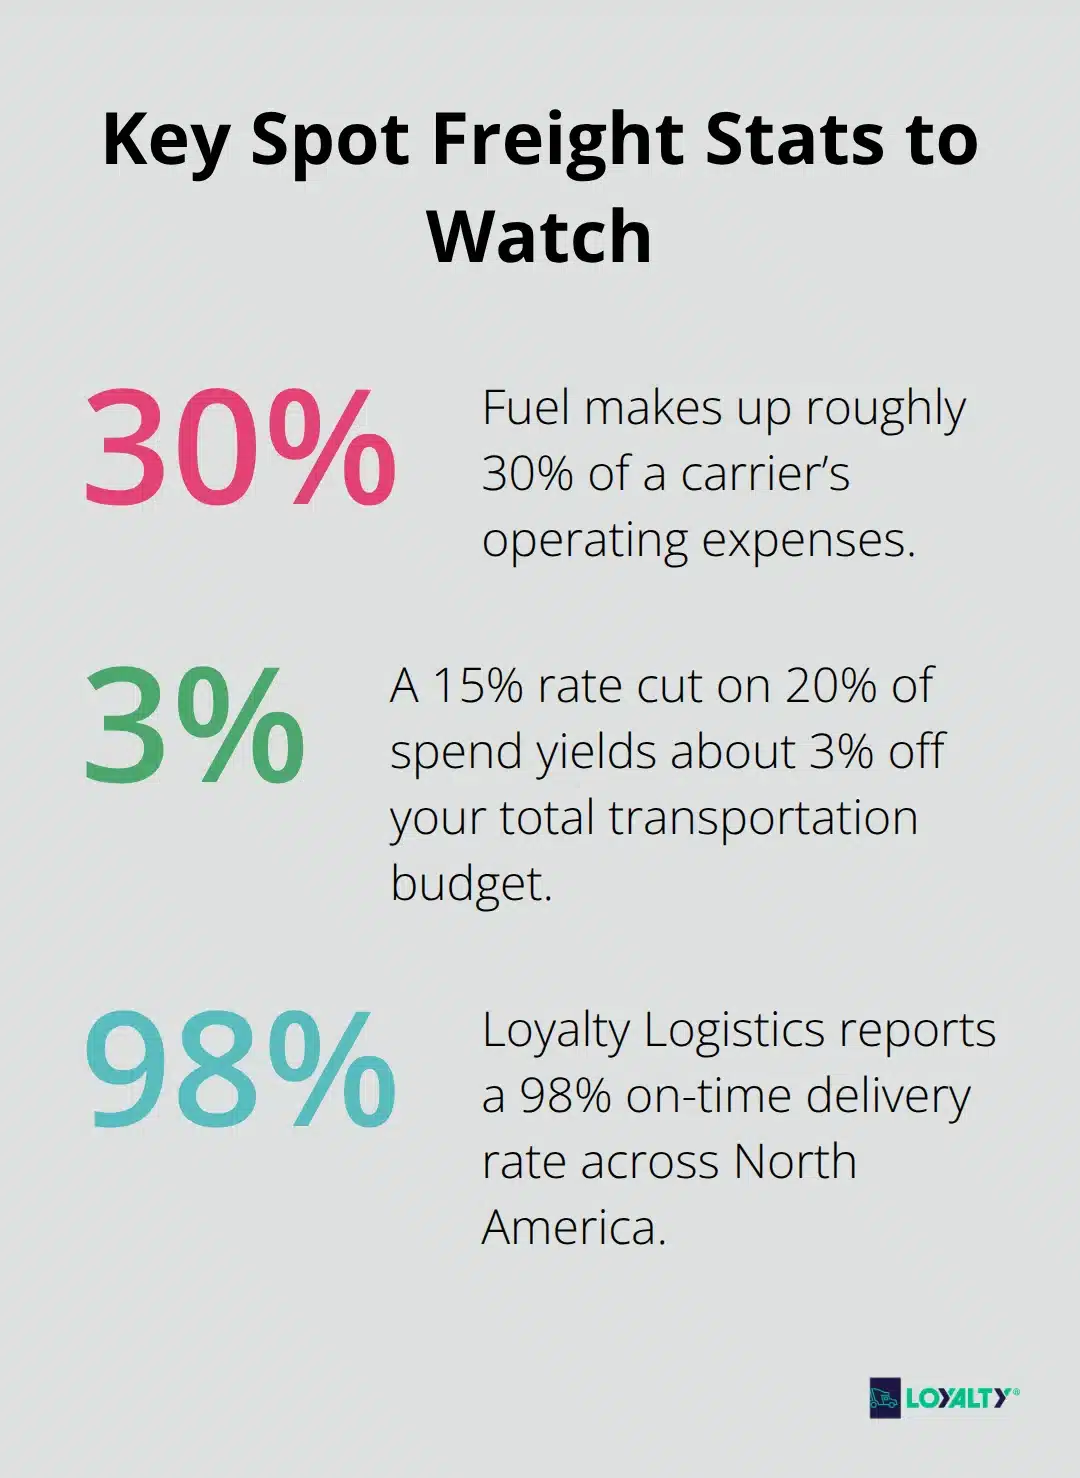
These actions take roughly four hours of setup but save 8–12% on your spot freight spend annually. That’s real money-thousands of dollars for most operations. Contact Loyalty Logistics to learn how we help logistics managers across the U.S., Canada, and Mexico optimize their freight strategies with timely, damage-free delivery and a 98% on-time rate.
